On this page:
 MyPay was built by the collective goodwill of thousands of PSA members who shared their salary data in the spirit of working together for fairer, more transparent pay systems for all.
Why pay transparency is important
Up until now, pay data has been used by employers to inform employer decision-making, rather than being available to workers to inform theirs.
There is no doubt data about pay rates is a powerful thing, but for too many workers it’s been out of reach. For too long PSA members have been making big decisions about their careers without full information.
This PSA pay transparency tool changes that.
Check out the MyPay tool now (log-in required)
Not a member yet but want to access MyPay? Become a member today!
Reading the MyPSA data
Through MyPay PSA members can dig down into our pay survey data to find out more about pay for specific jobs and job categories.
The data behind MyPay can also help us answer some big questions about pay across the public and community sector organisations where PSA members work.
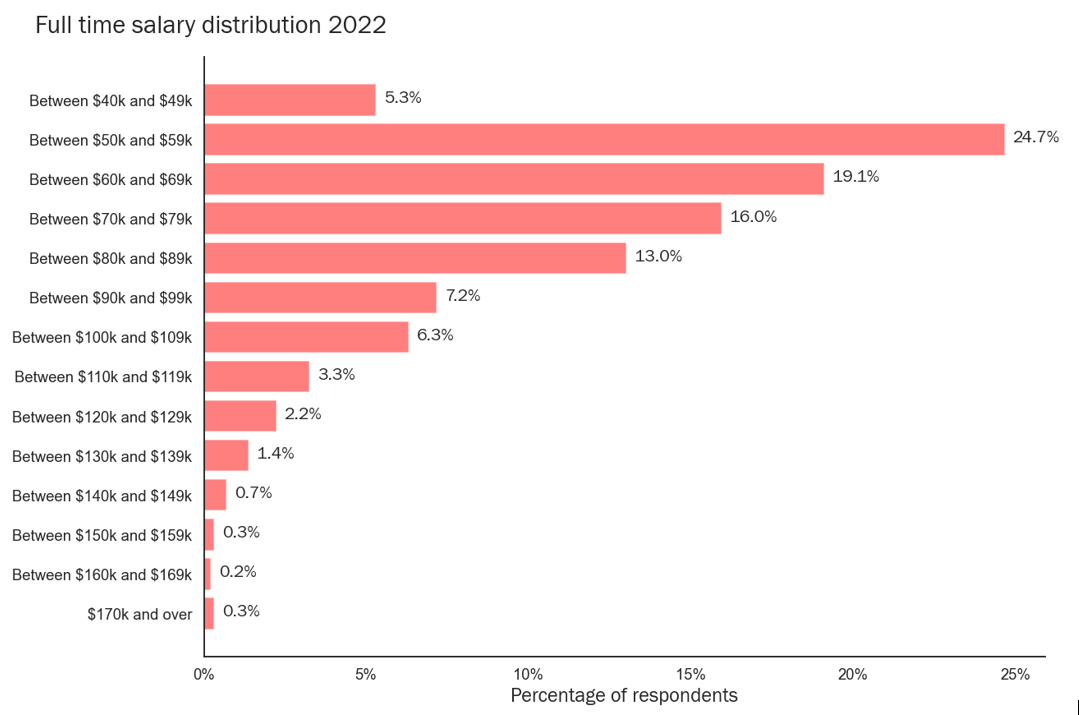
Click to enlarge image
This chart shows what proportion of people are paid what level of salary in $10, 000 bands.
How do I read this chart?
4 out of 5 PSA members earn $80,000 or less for working full time. The median full-time salary was $70,000 and the average full-time salary was $75,286.
This is higher than the median 2022 full time salary ($61,839) and average full-time salary ($75,720) in the overall New Zealand workforce. This does not mean that pay rates are higher in the public than in the private sector. The higher median salary for jobs in the PSA’s areas of coverage reflects the greater requirement for higher qualifications than in the overall workforce. People working in public and community services are also on average older and have more work experience than the overall New Zealand workforce.
Click to enlarge image
This chart shows the range of what people are paid across the main occupational groups that PSA members work in. Each of these groups is made up of a number of jobs – PSA members can dig into pay for each of these jobs in MyPay.
How do I read this chart?
For each occupational group, 25% of people working in jobs in that group are paid at or below the coloured box and 25% are paid at or above. 50% of people are paid within the box - the line inside the coloured box is the median of what people are paid – so 50% are paid this or less.
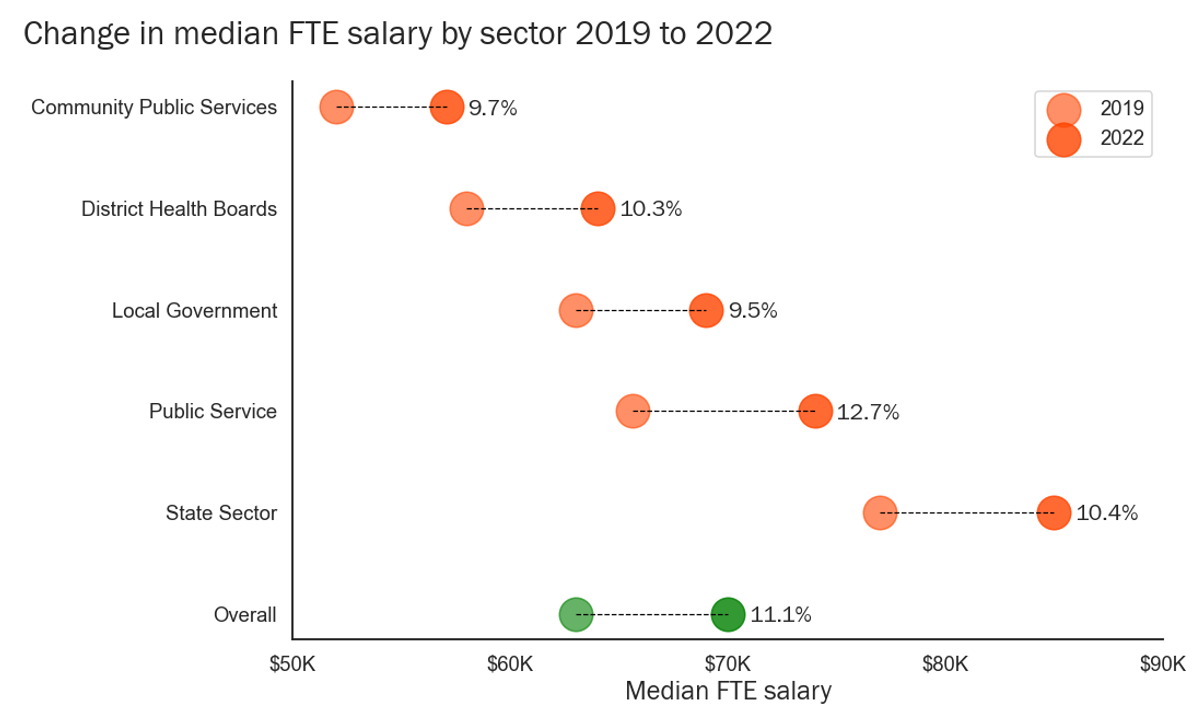
Click to enlarge image
Pay has increased differently in each of the parts of the public sector PSA members work in. Overall, the median salary of PSA members increased by 11.1% since 2019. The median income from wages and salaries of all New Zealanders increased by 16.3% over this same time. This overall lower rate of increase in public sector pay compared with private sector pay reflects public sector “pay restraint” over the COVID period and means public sector pay rates are falling further behind private sector rates.
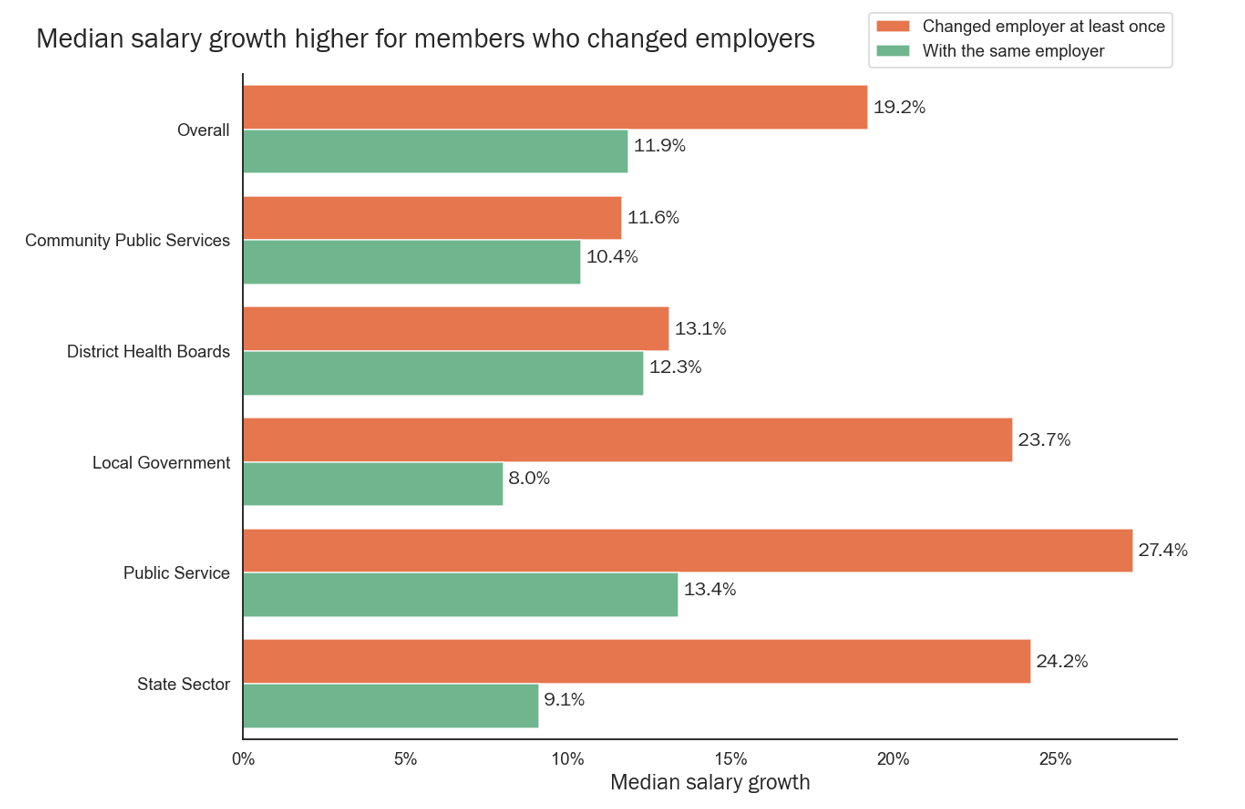
Click to enlarge image
Amongst respondents to both the 2019 and 2022 surveys, people who changed jobs were more likely to have had higher increases in pay. This varies depending on which part of the public sector you work in.
Yes, amongst respondents to both the 2019 and 2022 surveys we found that lower paid workers received much larger relative increases than higher paid workers.
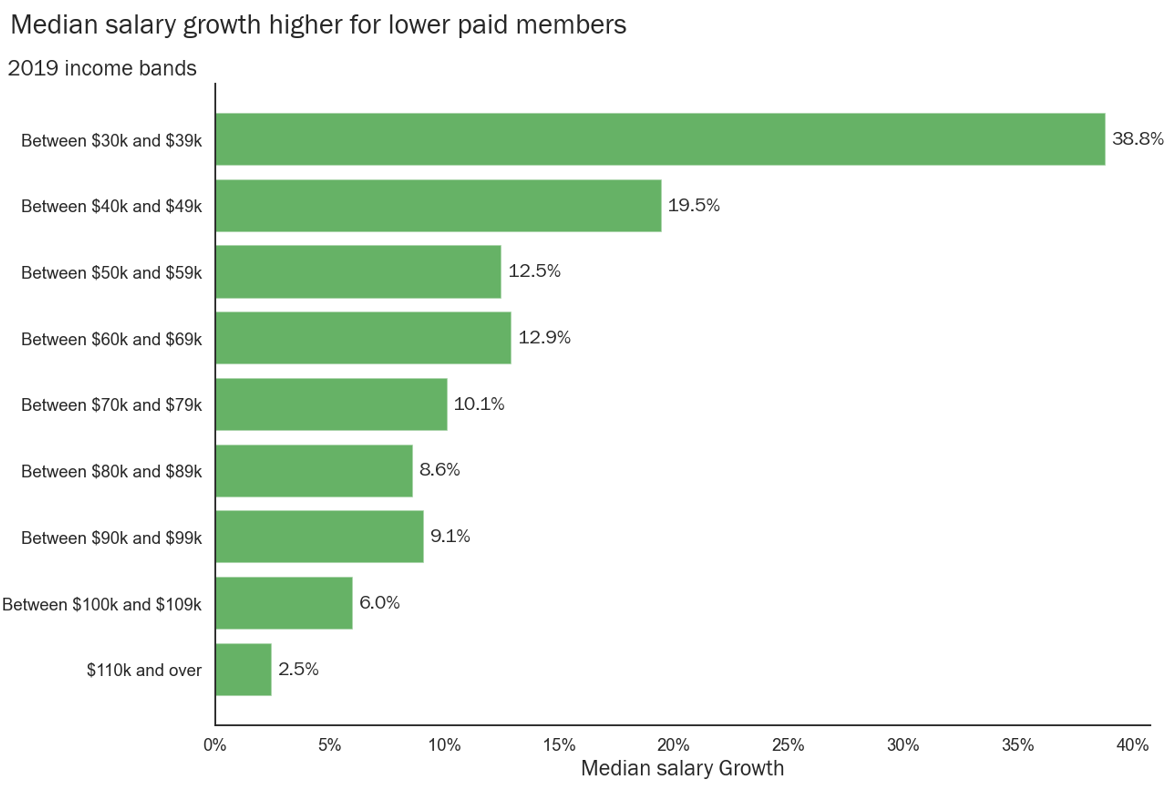
Click to enlarge image
We also found that younger workers were both more likely to have changed employers at least once and more likely to receive a higher relative pay increase.
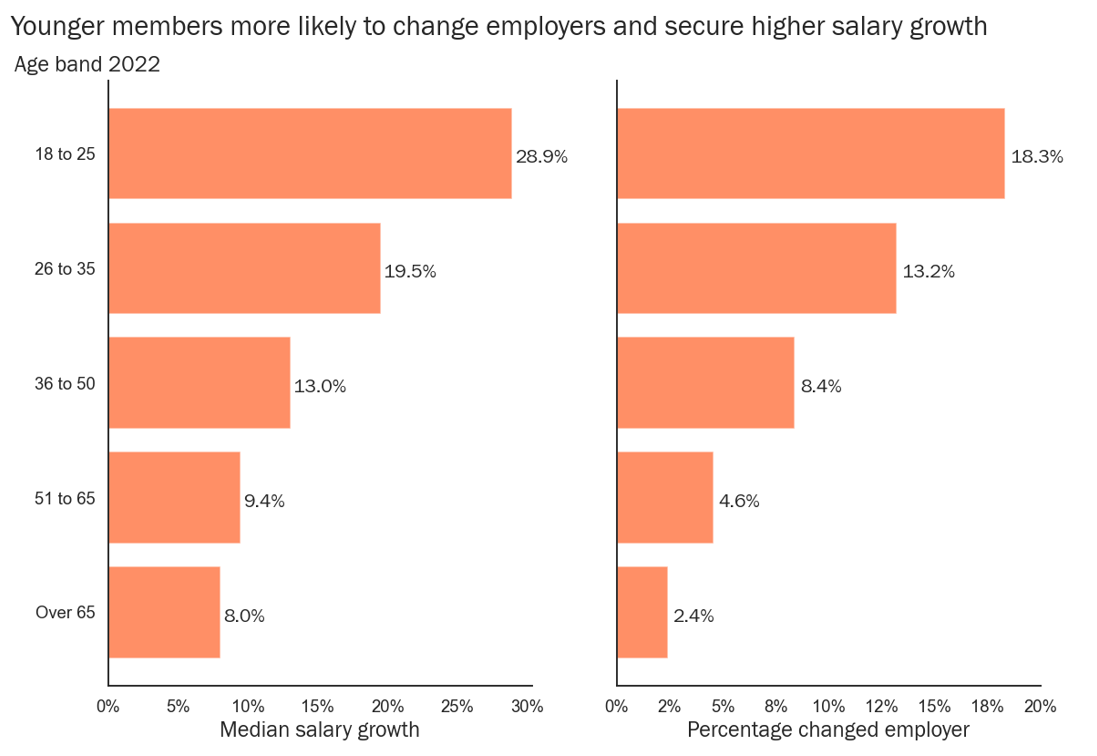
Click to enlarge image
Yes. It’s clear that there are both gender and ethnic pay inequalities across and within the occupations PSA members work in. In MyPay, you can dig into the gender and ethnic pay differences within jobs using the “gender” and “ethnicity” tabs.
The overall data from the survey shows that different genders and ethnicities are concentrated in different jobs and that women and particular ethnicities are more likely to be concentrated in lower paid jobs. This chart shows the overall differences in pay between Pacific, Māori and European people by gender. PSA members can log into MyPay to see pay for individual jobs by gender or a full range of ethnicities.

Click to enlarge image
How do I read this chart?
For each group, 25% of people are paid below the coloured box and 25% are paid above it. 50% are paid within the box and the line in the middle of the box is the media
n of what people in that group are paid. The “whiskers” are the 25% of outliers at each end and show the total range of what people in that group are paid.”
They have reduced for some groups but for others, notably Pacific women, they have hardly budged.
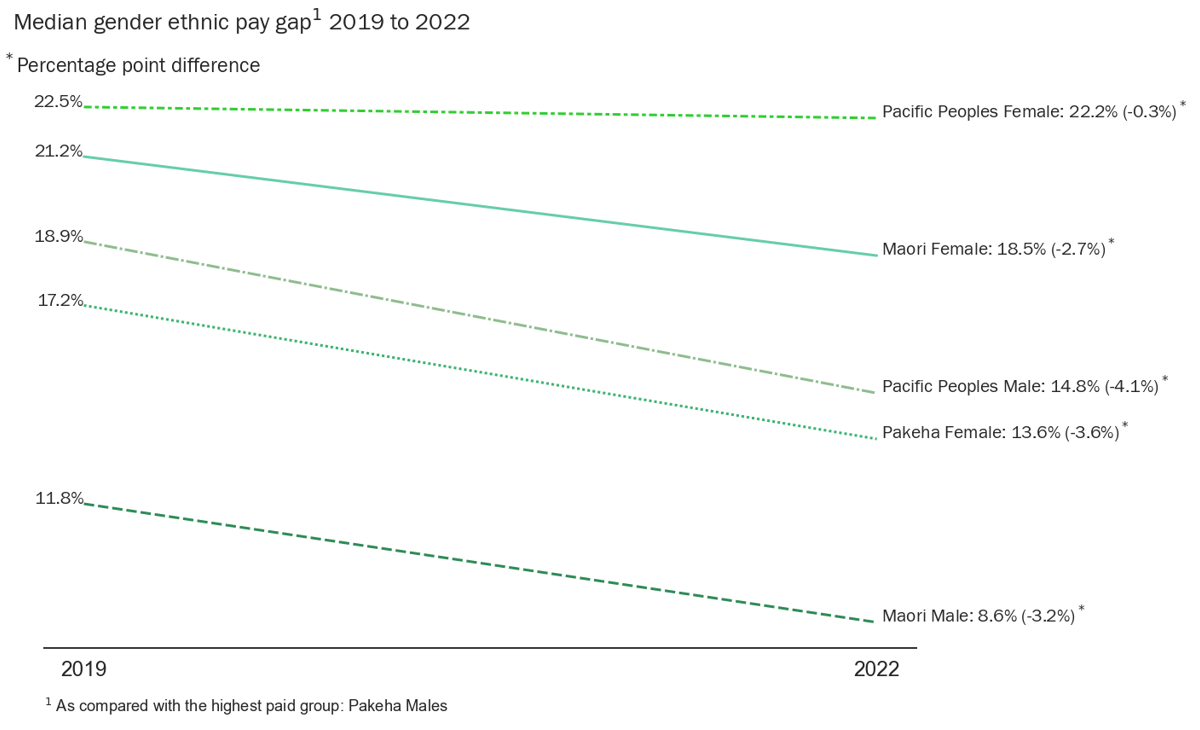
Click to enlarge image
Yes, you can see from this chart that gender pay gaps are much smaller for younger people and that they increase with age.
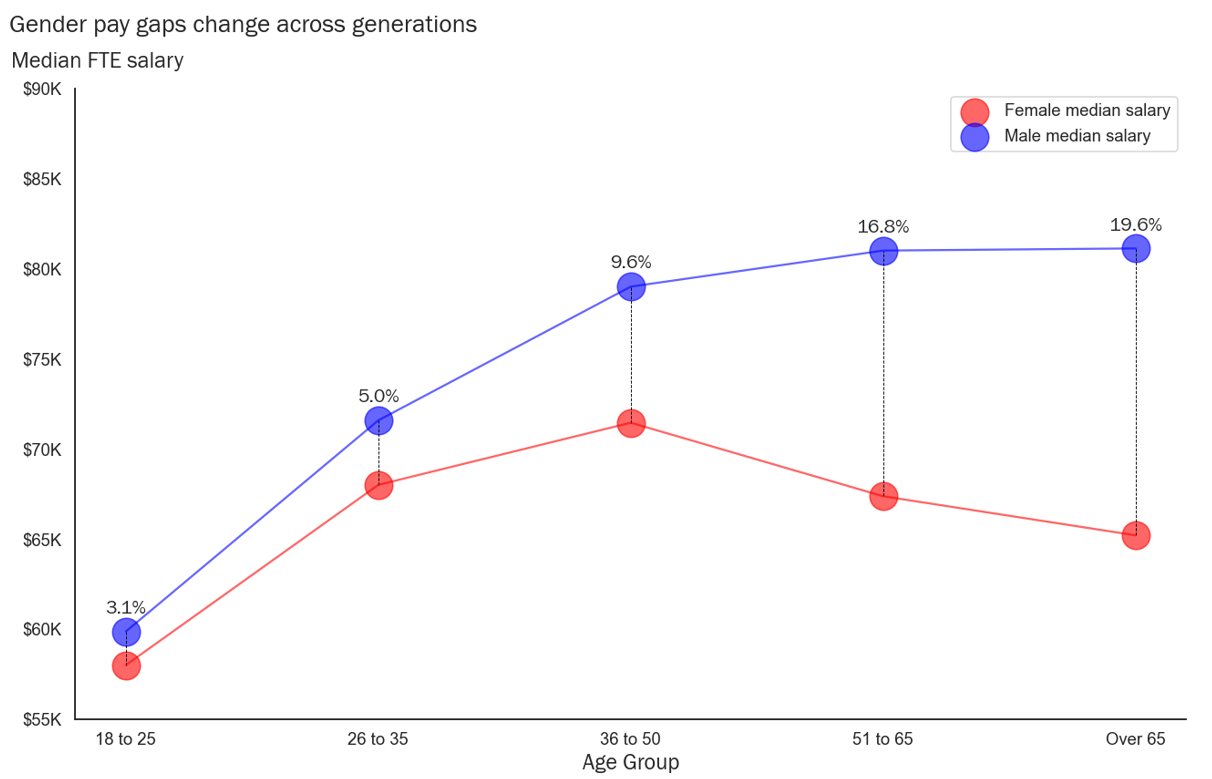
Click to enlarge image
Yes. PSA members work across the public sector. Within the PSA membership, local government has the largest pay gaps.
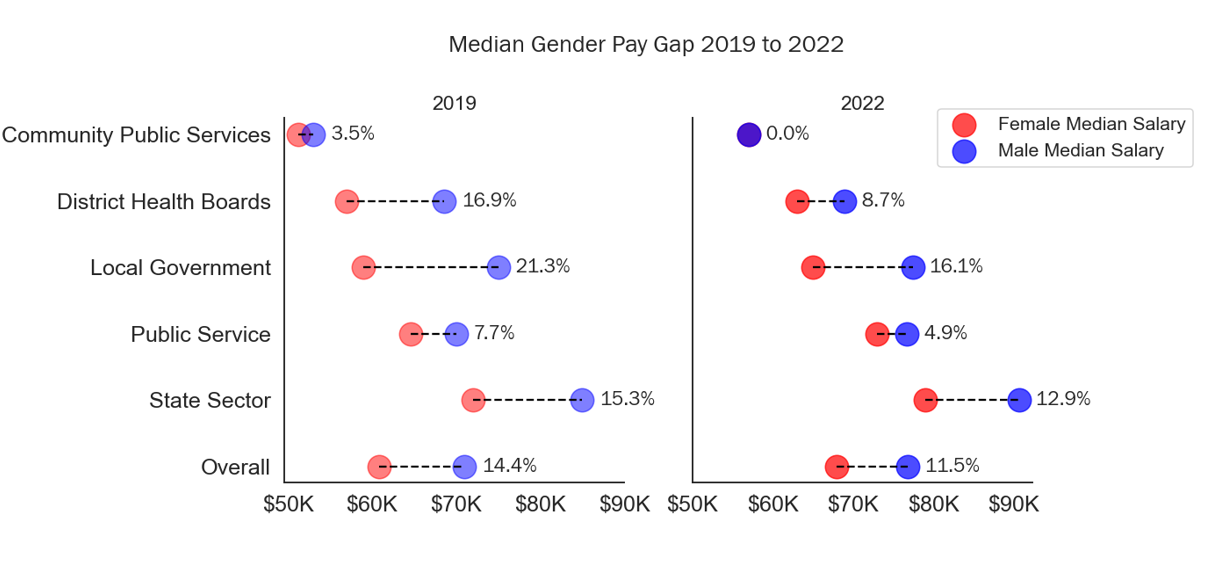
Click to enlarge image
PSA members work in different parts of the public sector – for Crown entities and SOEs (SS), public service departments (PS), local councils and their subsidiaries (LG), Te Whatu Ora Health NZ (DHB) and in funded community services and other NGOs (CPS). This chart shows the distribution of what PSA members are paid in each of those sectors.
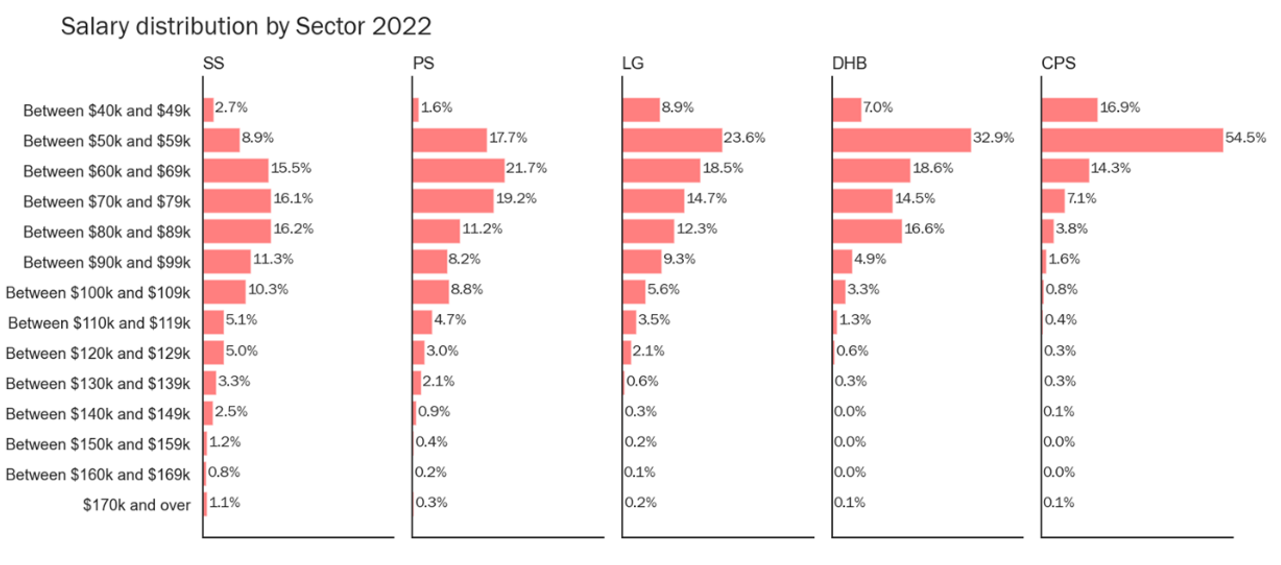
Click to enlarge image
MyPay FAQ
Over 82,000 people are members of the PSA. Around a third work in Auckland, a third in the Wellington region and a third around the rest of the country. They work for: Te Whatu Ora Health NZ in admin, allied and technical professions; Public Service departments; other State services – crown entities, State Owned Enterprises etc; for local councils; and in community public services – contracted providers (disability, health and social services).
This tool is thanks to members and for members. You need a MyPSA login to use the tool. While we will make information explaining the tool public, the data itself is intended to be used by members. If you don’t yet have a MyPSA login, you can register for this from the MyPSA link on the front page of the PSA website. You just need your PSA member number. You’ll find this in the subject line of the last monthly PSA News newsletter emailed to you from update@psa.org.nz.
A May 2022 pay survey of PSA members. 24, 000 PSA members shared their pay information and we have used this to build the tool. We also ran this survey in 2019 and we’ve used this to do some analysis of pay movement. We plan to run future pay surveys to keep the information current and make it even more useful.
The work our members do is varied. Official job titles often don’t describe the work that the jobholder does, so we’ve used the Australian and New Zealand standard classification of occupations (ANZSCO) system. We have adapted some of the descriptions to be as functionally descriptive as possible. We’ve tried to strike a balance between providing enough detail while reducing the overlap between occupations. If you enter your job title in the search function you will see the occupations that are most frequently associated with the given job title.
It’s because we didn’t have enough data for that to display it with accuracy. We’ve used StatsNZ standards to decide when we have enough data to display for each particular item. Next time we run the pay survey that feeds this tool please encourage your colleagues to do it so that we have even more data next time round and can show more.
This tool allows members to see and compare the salaries for different occupations. It also allows members to see what the median salary is for different variables including gender, age, ethnicity, region and length of service.
Having information available about pay helps people make decisions about what jobs to do, what career moves to make. It let’s you know whether or nor you are being paid fairly and uncovers unlawful pay discrimination. The PSA supports the Human Rights’ Commission’s campaign for pay transparency and its Pacific Pay Gap inquiry and the Mind the Gap campaign.
Only PSA members can access the tool. If we had genuine pay transparency, leaders and HR professionals would also benefit. It would support better workforce planning, make clear career pathways and shine a light on systemic problems. Organisations can then make more informed decisions about equal pay, bargaining and workforce strategies.
Median salary is the point where 50% of the responses are below and 50% of the responses are above. At its most basic, it’s what most people are paid. It is common to report the median when discussing salaries as it’s less affected by very high or very low values.
Full time equivalent salary is the annual salary that someone would receive if they were working 40 hours a week. In some organisations full time may refer to someone working less than 40 hours ie; 37.5 hours. In this case, someone on an annual salary of 50K working 37.5 hours per week is paid a slightly higher hourly rate than someone on the same pay working 40 hours a week. Using 40 hours as a consistent basis means we can better compare salary rates.
You can ask your employer for information about pay for your role or in your organisation but they have no obligation to share it. Pay rates for public and community sector jobs are not publicly available in New Zealand. Employers provide this information to private salary survey companies and then buy pay rate and movement reports based on this information. This information is not available to individuals or to the unions negotiating their pay.
We can use the data in behind this tool but the data displayed in the tool is not detailed enough for this purpose. It can though help us identify key issues and know which questions to ask. In preparing to negotiate pay on behalf of its members in an organisation, your PSA advocate can request detailed pay information from that employer. This is the level of pay information needed for collective bargaining.
We don’t have the capacity to provide this. There is a lot of information available in the tool and we’d encourage you to take a look at the advanced view function.
- As you are already a member of the PSA that is a great start!
- Encouraging others to join will also help – this tool is a great example of what we can do when we act together. Share information from this tool with a colleague and ask them to join https://www.psa.org.nz/join-the-psa
- Become a PSA delegate – put yourself forward next time there’s an election in your workplace
- Contact your PSA delegate to get involved with bargaining and other PSA activity
- Check out the Human Rights Commission’s Pacific Pay Gap Inquiry and the Mind the Gap campaign.
- Take the data into your next pay discussion with your manager
- Use it to make decisions about which job to move to next